spc
SPC Explained: 2023 Guide
SPC is a statistical method of quality control that collects and analyzes data from product and process measurements for improved process capability.
Learn more about measurement systems analysis and the future of MSA through MBD.
Measurement Systems Analysis (MSA) is a statistical process used to assess the amount of variation in the measurement process introduced by the measurement system itself.
In the manufacturing industry, variability within the process and product is inevitable.
The role of manufacturing quality ensures that the process and product conform to specifications and that any variability falls within acceptable tolerances through measurement and data collection.
But how do you know if your measurement is accurate?
What if the measurement equipment (gage) is inaccurate or incorrectly calibrated? What if the operator carrying out the work is inconsistent? What if there’s a big difference in measurement values between two operators for the same part?
Then, all measurements and data would be flawed, leading to a flawed process and flawed product.
MSA examines these three crucial details :
MSA is part of the five Core Tools for effective quality management with APQP, PPAP, FMEA, and SPC being the other core tools.
Measurement System consists of the following:
- Equipment and tools: Gages, testing instruments, etc.
- Operator: Training, assumption, fatigue, etc.
- Standard operating procedure.
- Environment.
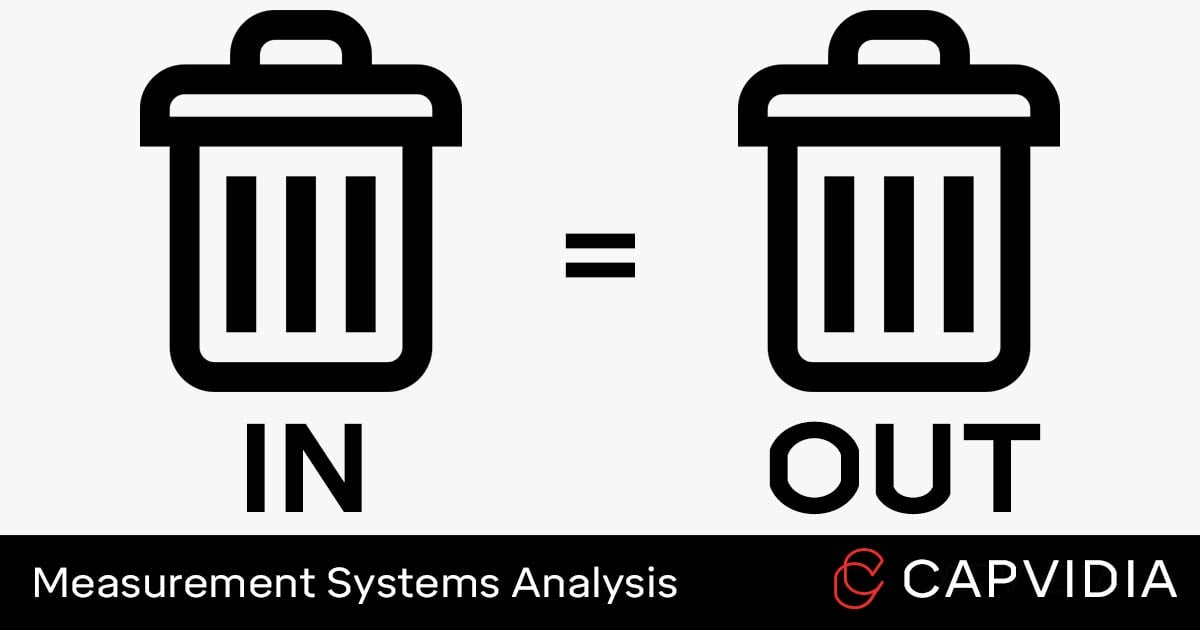
MSA looks for the classic case of garbage in, garbage out.
Accurate measurements lead to accurate data lead to the best possible decisions for designing and manufacturing a product.
However, faulty measurements lead to faulty data and poor decisions for designing and manufacturing a product.
The results?
Expensive scrap, rework, defects, retesting, and recalls, which is known to be 29X more expensive for corrective action in the operations phase compared to planning phase.
Quality decisions come from quality data.
MSA confirms the integrity of your measurement systems.
5 Benefits of MSA:
- Prevents For Want of a Nail or GIGO situation.
- Identifies and reduces measurement errors.
- Improves process reliability, quality, and safety.
- Confidence in data to make better decisions.
- Increased customer satisfaction.
MSA is necessary in various scenarios within an organization's quality management and process control activities. For example:
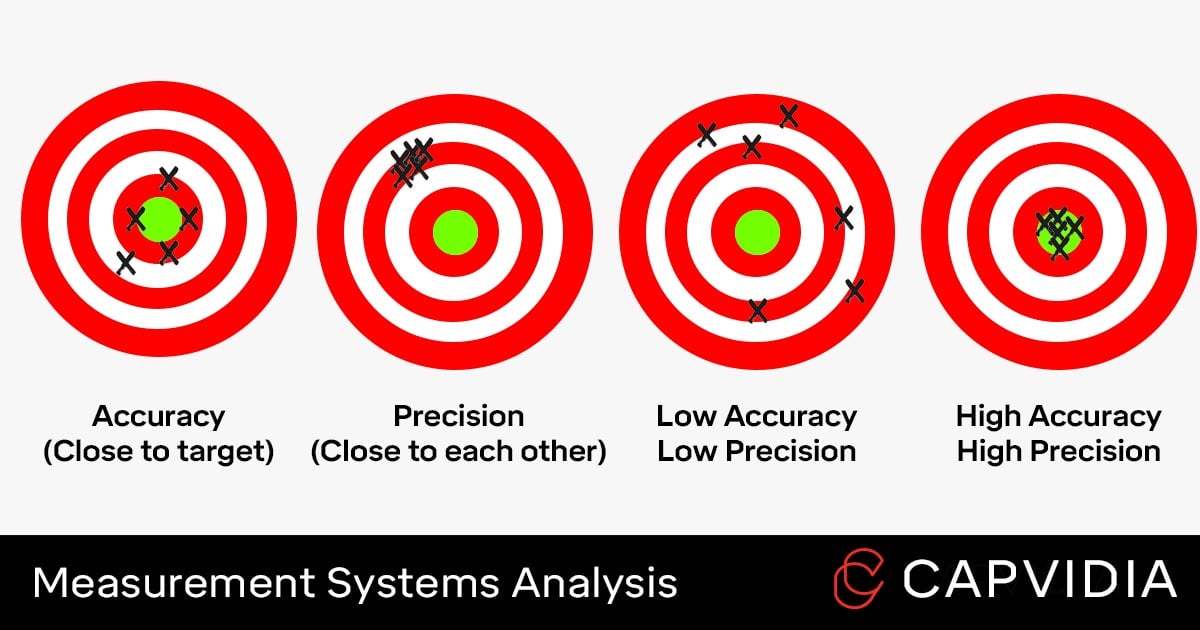
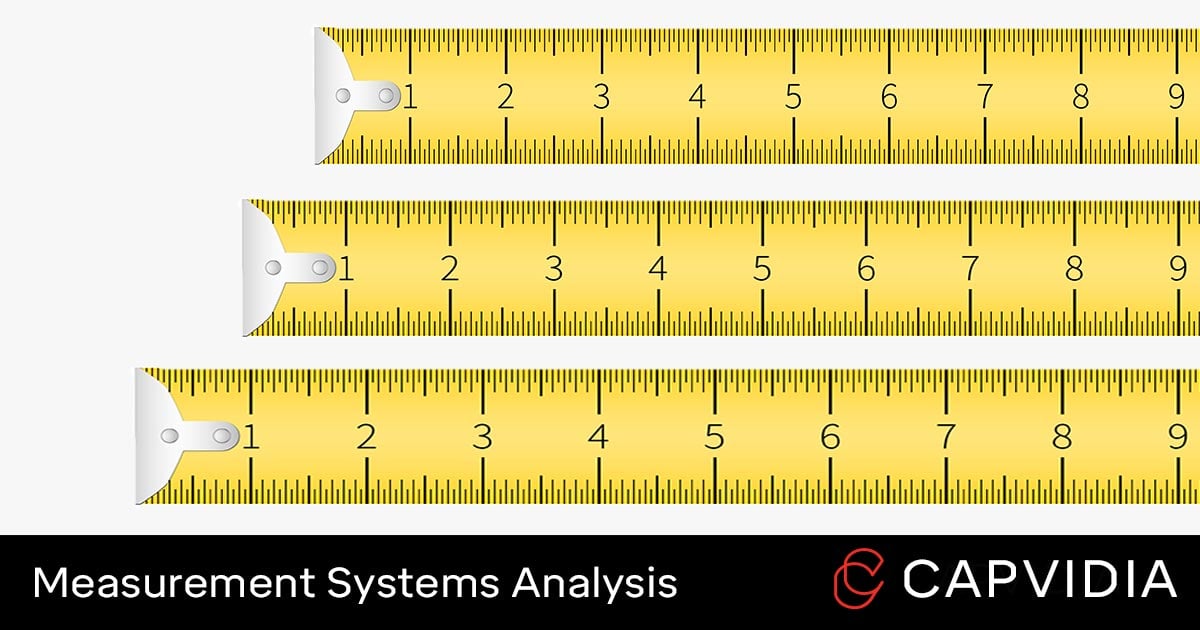
The MSA confirms the fidelity of measurement variation. Measurement variation is defined by accuracy and precision.
Accuracy is the average measurement close to a reference value (master sample).
Accuracy includes:
Let's use a bathroom scale as an example.
Stability: Assuming your body weight remains the same, will the reading be the same today as tomorrow or a week from now?
Linearity: Assuming heavier or lighter family members weighed themselves, would the measurement scale appropriately?
Resolution: How detailed is the measurement from a mechanical scale vs a digital scale?
Bias: What if the scale’s resting point starts out at 5 pounds instead of 0?
Precision is a consistent measurement each time or the closeness of two or more measurements to each other.
Precision includes:
Let’s use a cooking recipe in this example.
Repeatability: Could the same person use the same recipe and the same equipment to produce a consistent dish repeatedly?
Reproducibility: Could a different person take the same recipe and same equipment and produce that same dish repeatedly?
Gage studies are MSA tools used to understand measurement uncertainty due to possible errors in measuring accuracy and precision.
A Type 1 Gage study identifies any deficiencies in the measurement system.
One operator measures a reference part multiple times, usually over 50. The mean of all measurements is then subtracted from the reference part’s value producing the bias.
If measurements fall outside the acceptable tolerance range, then there may be a problem with gage accuracy.
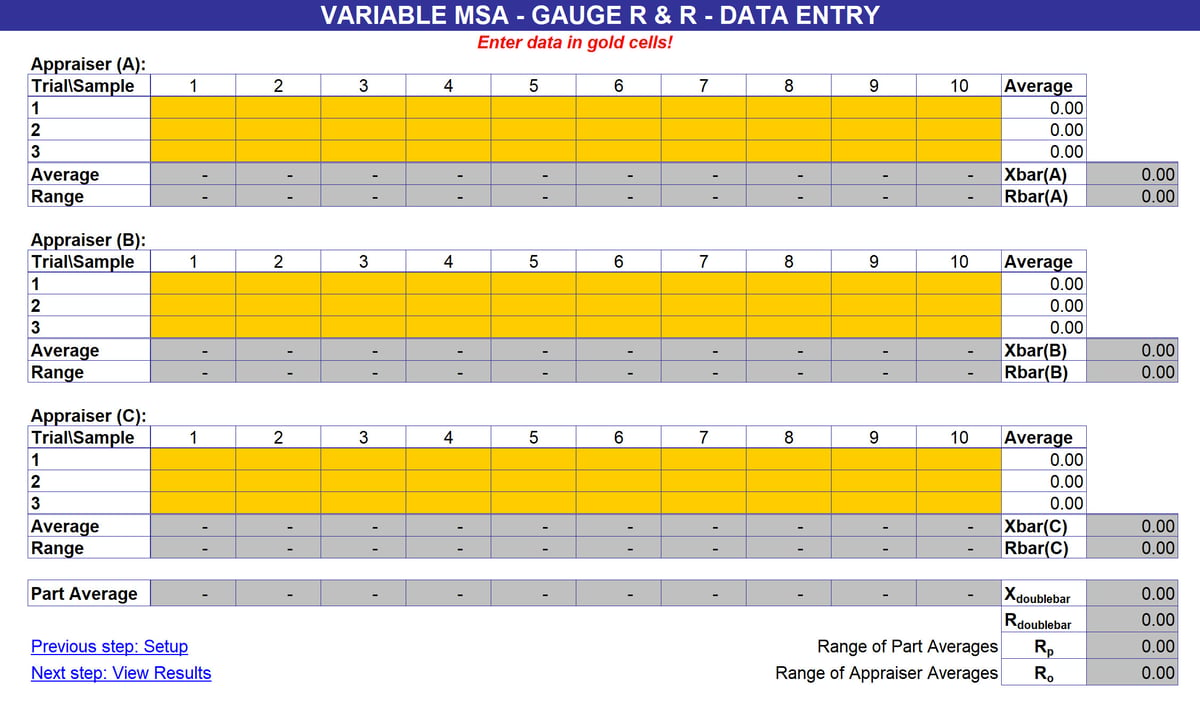
A Gage R&R (Repeatability & Reproducibility) study estimates the combined variation caused by repeatability and reproducibility errors.
It determines two important aspects: how much variation is due to equipment (gage variability) and how much variation is due to personnel (operator variability).
The end results are calibration or replacements to gages and measurement tools and updated training and procedures for operators.
There are two types of Gage R&R studies: Gage R&R for variable data (infinite values) and Gage R&R for attribute data (specific values).
Here are the recommended conditions for both:
Recommended Gage R&R study for variable data:
Recommended Gage R&R Study for attribute data:
The Gage R&R study results in a score to be compared against the reference value produced by the master sample.
Below are the guidelines for judging acceptability.
Acceptable criteria for Gage R&R Study for variable data:
Acceptable criteria for Gage R&R Study for attribute data:
| Decision for Operator | Effectiveness | Miss Rate | False Alarm |
| Acceptable | ≥90% | ≤ 2% | ≤ 5% |
| Minimally acceptable but needs improvement | ≥80% | ≤5% | ≤10% |
| Unacceptable | ≤80% | ≥5% | ≥10% |
| Kappa Value | ≥75% | ||
Typically, if a repeatability value is more considerable compared to the reproducibility value, then it’s possibly a gage error. If the reproducibility value is more substantial compared to the repeatability value, then it’s most likely operator error.
Stability:
Linearity:
Bias:
Repeatability:
Reproducibility:
Source: Measurement Systems Analysis 4th Edition by AIAG (Automotive Industry Action Group)
MSA produces valuable data for immediate but also long-term improvements.
Most data is viewed as pass/fail and often discarded despite an era in which digital is king and data is the new oil.
A model-based definition (MBD) introduces data back into the ecosystem for improved designs, improved parts, and improved operations done quicker, cheaper, and more efficiently.
MBD is a growing industry practice of having the 3D CAD model be the “single source of truth.”
This means the CAD model along with semantic product and manufacturing information (PMI) can drive the MSA, APQP, PPAP, and SPC reports along with containing GD&T, bill of materials, notes, engineering change orders etc. for an improved method of inspection generation and automating other manual processes.
The power of MBD-based approach is the human and machine readability factor allowing for interoperability between machines and software with less reliance on human process and interpretation.
MBD Benefits:
- Automated: No need for human transcription or interpretation.
- Build and optimize a reliable and repeatable process.
- Data mapped back to the single source of truth.
- Start of the digital transformation from design to manufacturing.
- Valuable data to mined for analytics and business insights.
Gage R&R alone isn't enough for a complete MSA, because it is possible to have results that are repeatedly and reproducibly incorrect aka the data looks "good."
Measurement bias must also be included to ensure the accuracy of the measurement system.
Pundit captures both repeatability and bias measurements to limit the risks and also the financial impact of parts that meet spec but do not work of fit.
What Pundit does:

Pundit: Smart CMM Inspection Simulation Software.


Contact us and we'll glad to help answer questions about MSA and preventing measurement errors.
SPC is a statistical method of quality control that collects and analyzes data from product and process measurements for improved process capability.
Learn more about 5 Core Quality Tools for preventing and minimizing error, improving the manufacturing process and product, and impacting the company...
Learn more about APQP and the APQP process for quality improvements in the manufacturing process and product requirements.