core tools
5 Core Quality Tools | Manufacturing
Learn more about 5 Core Quality Tools for preventing and minimizing error, improving the manufacturing process and product, and impacting the company...
SPC is a statistical method of quality control that collects and analyzes data from product and process measurements for improved process capability.
Statistical Process Control (SPC) is a statistical method used in manufacturing and quality control to monitor and control a process.
In the manufacturing industry, a poor product—defined as not meeting spec— often results from a poor process.
SPC collects and analyzes data from product and process measurements.
The goal is to determine what falls within vs outside of the process capability, leading to preventive or corrective actions when needed.
SPC is part of the five Core Tools for effective quality management with APQP, PPAP, FMEA, and MSA being the other core tools.
Goal of Statical Process Control:
- Understand process and spec limits.
- Ensure a stable process.
- Monitor ongoing process for improvement or corrective action.
Within the manufacturing industry, the Cost of Poor Quality (COPQ) measures costs associated with process and product failures.
Top-performing manufacturers have a COPQ rate around 1% while subpar manufacturers have a score of 5% or higher.
This translates to subpar manufacturers about 5X more likely to pay in scrap, rework, defect, retesting, and recall costs compared to the industry leaders.
SPC statistically evaluates a process that is efficient, cost-effective, and can improve.
Most importantly, it is a method of prevention that saves more time and money, because scrap, rework, defects, retesting, and recalls are 29 more expensive for corrective action in the later stages compared to earlier stages.
5 Benefits of SPC:
- Prevents Garbage in, garbage out GIGO situation.
- Identifies and reduces processes errors.
- Improves process reliability and quality.
- Prevents non-conforming products
- Better customer satisfaction.
All manufacturing processes produce variability. It’s a natural part of the process.
The SPC investigates data from process and product measurements to determine whether the variation is acceptable or not.
Variation in manufacturing has two classes:
About 85% of variations are common cause, while around 15% are special cause.
But how do we define what is common or special cause variation?
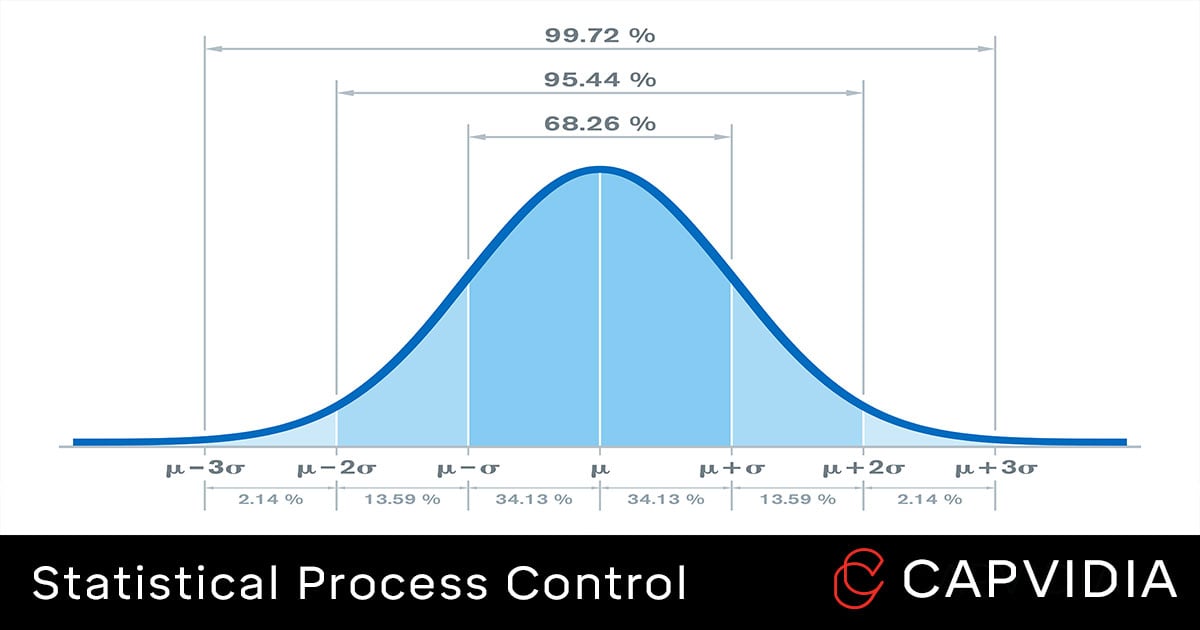
As long as the data is within ±3 standard deviations from the mean, it represents 99.73% of acceptable values (common cause variation). Anything outside the ±3 standard deviations from the mean is unacceptable (special cause variation).
For example, a normal commute to work might take 30 minutes plus/minus 10 minutes.
The 30 minutes is the mean with the ± 10 minutes representing the acceptable deviation range.
If we were to plot a whole month’s worth of commute data, then nearly all data should fall between 20 to 40 minutes for commuting to work aka common cause variation.
However, if there is one day when the commute time is 1 hour and 5 minutes, it’s beyond our acceptable range, and we have to find out why. The reason? A flat tire that caused a delay, aka special cause variation.
The goal of the SPC is to eliminate special cause variations.
There are 14 quality control tools used in SPC. Seven are quality control tools, and the other seven are supplemental tools.
Quality Control Tools:
Supplemental Tools:
The control chart is the most utilized tool in SPC.
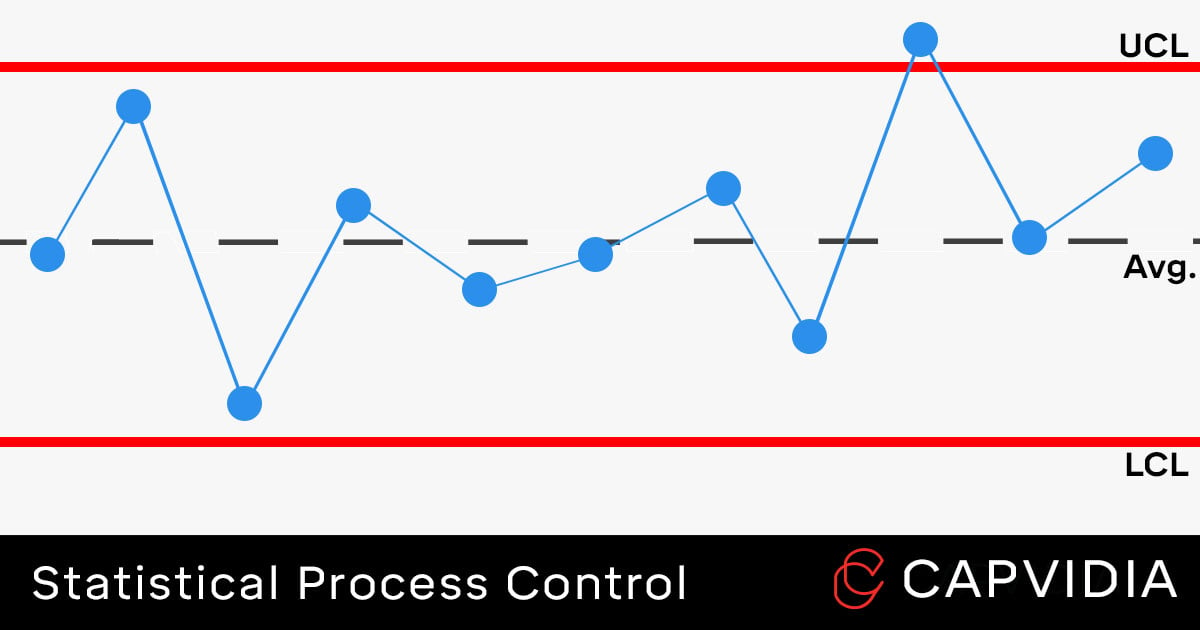
A control chart visually represents the gathered data with pre-set control limits. Think of the control chart as a bell curve laid sideways to see the time sequence of data points.
The control limits, as explained above in the variation section, are ±3 standard deviations from the mean.
Anything that falls within that range between the upper control limit (UCL) and the lower control limit (LCL) is acceptable.
Anything outside that range is unacceptable and defined as special cause variation as shown below.
It’s important to know that control limits are different from specification limits. Control limits represent the voice of the process (what’s feasible) while specification limits represent the voice of the customer (what’s expected). Ideally, control limits should fall within spec limits.
Selection of the right control chart depends on the type of data: variable (continuous) or attribute (discrete). Variable data is preferred when available.
Control charts for variable data:
Control charts for attribute data:
After all data is plotted on the control chart, it should fall between the control limits.
Examples of common cause variation include:
Anything outside the control limits is a special cause and must be addressed.
Examples of special cause variation include:
However, there can be situations where all data points are within control limits but still potentially be “out of control.”
Common cause variation data points should be within control limits but also randomly plotted. If a discernable pattern can be noticed, then further investigation is needed.
Examples of within control limits but out of control process includes:
Two Phases of SPC
- Phase 1: Identify and establish process to eliminate special cause variations.
- Phase 2: Predict future measurements and improve process.
SPC collects and produces valuable data for immediate but also long-term improvements.
Most data is viewed as pass/fail and often discarded. But in a century of Big Data & AI, using data to drive process and business decisions is the new normal.
A model-based definition (MBD) introduces data back into the ecosystem for improved designs, improved parts, and improved operations done quicker, cheaper, and more efficiently.
MBD is a growing industry practice of having the 3D CAD model be the “single source of truth.”
This means the CAD model along with semantic product and manufacturing information (PMI) can make data collection for APQP, MSA, PPAP, and SPC more robust and faster in real-time as the digital thread head towards Industry 4.0 practices.
Most importantly, advanced analytics and deep learning has the power to elevate SPC workflows to the next level as the manufacturing industry leans into digital and data technologies.
MBD Benefits for SPC:
- Automated: No need for human transcription or interpretation.
- Build and optimize a reliable and repeatable process.
- Data mapped back to the single source of truth.
- Start of the digital transformation from design to manufacturing.
- Valuable data to mined for analytics and business insights

Contact us and we'll glad to help answer questions about SPC and improving process capability.
Learn more about 5 Core Quality Tools for preventing and minimizing error, improving the manufacturing process and product, and impacting the company...
Learn more about APQP and the APQP process for quality improvements in the manufacturing process and product requirements.
Learn more about production part approval process and PPAP reports through MBD. Automate ballooning and measurement reports easily.