spc
SPC Explained: 2023 Guide
SPC is a statistical method of quality control that collects and analyzes data from product and process measurements for improved process capability.
Learn more about 5 Core Quality Tools for preventing and minimizing error, improving the manufacturing process and product, and impacting the company bottom-line.
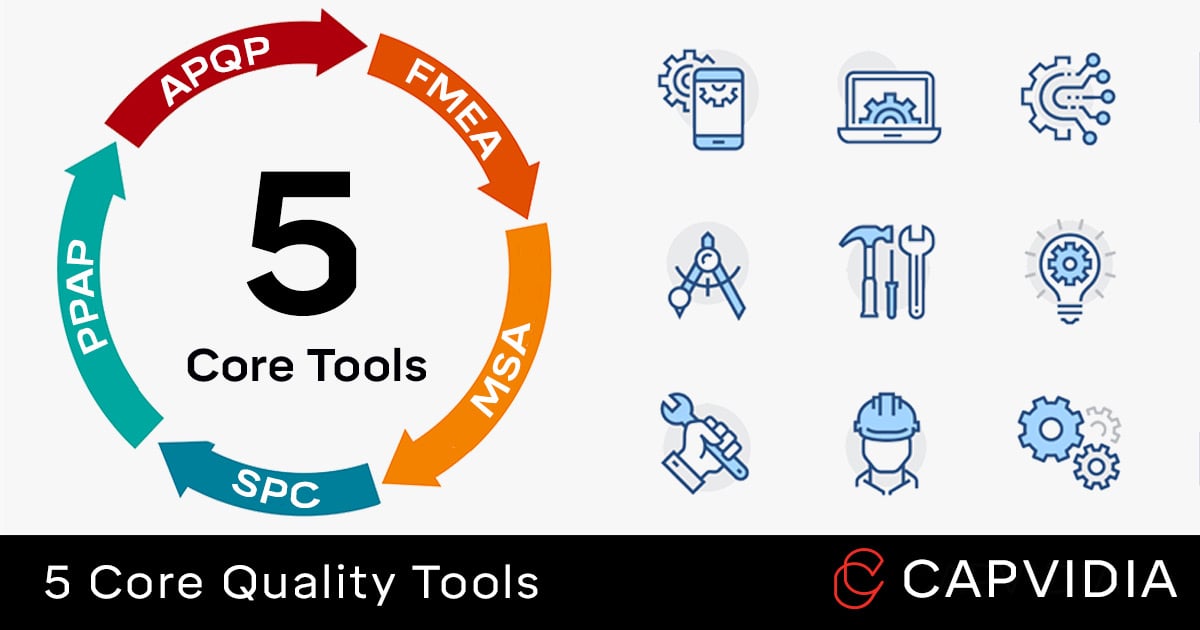
The 5 Core Quality Tools are a set of sequential methods that form the essentials of a quality management system based on the IATF 16949 standard.
The focus is to eliminate or reduce potential errors early in the manufacturing process rather than later— prevention vs cure.
The 5 Core Quality Tools are comprised of:
The 5 core tools are recognized as standard quality tools for the automotive industry by AIAG, although they are also used in other manufacturing sectors such as aerospace, defense, medical, and pharmaceutical.
Goal of 5 Core Quality Tools
- Establish streamlined communication across design and manufacturing.
- Catch potential errors earlier before it becomes a costly problem.
- Create reliable, better, and faster processes.
In the manufacturing industry, the cost of poor quality (COPQ) measures the financial cost associated with process and product failures.
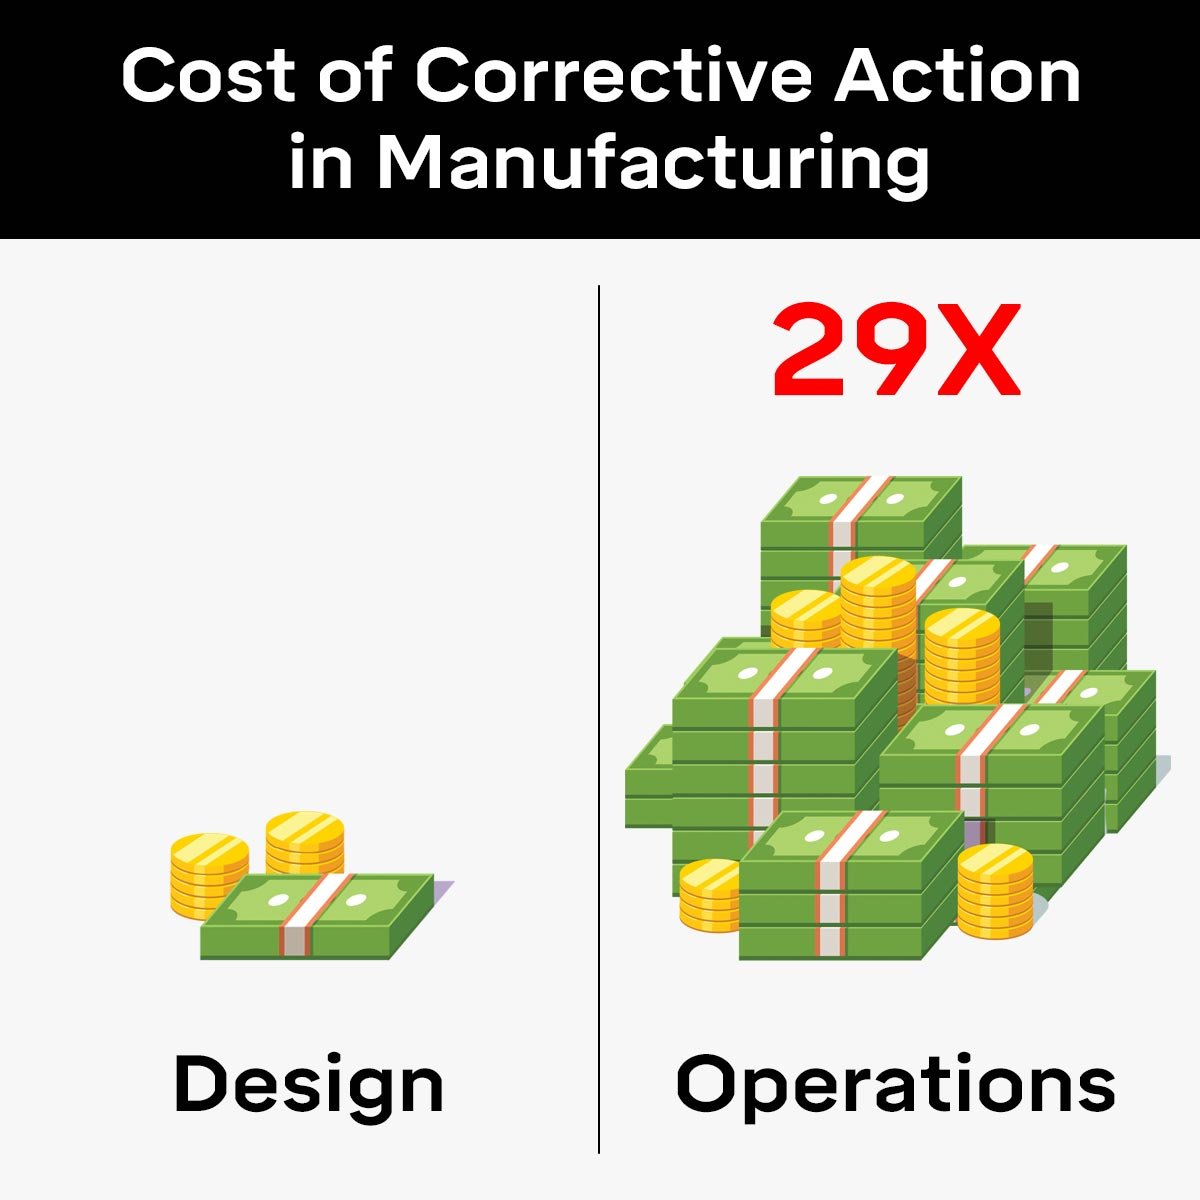
The best manufacturers have a COPQ score of around 1% whereas subpar manufacturers have a score of 5% or higher, which means subpar manufacturers are 5X more likely to pay in scrap, rework, defect, retesting, and recall costs compared to the leaders in the sector.
Therefore, the 5 Core Quality tools pre-emptively reduce COPQ by addressing problems, especially fatal flaws, before they become major problems after a product has been released. This is done by having better communication and understanding between the customer and supplier.
APQP in one sentence: “Do we understand the expectations and have a structured planning process for it?”
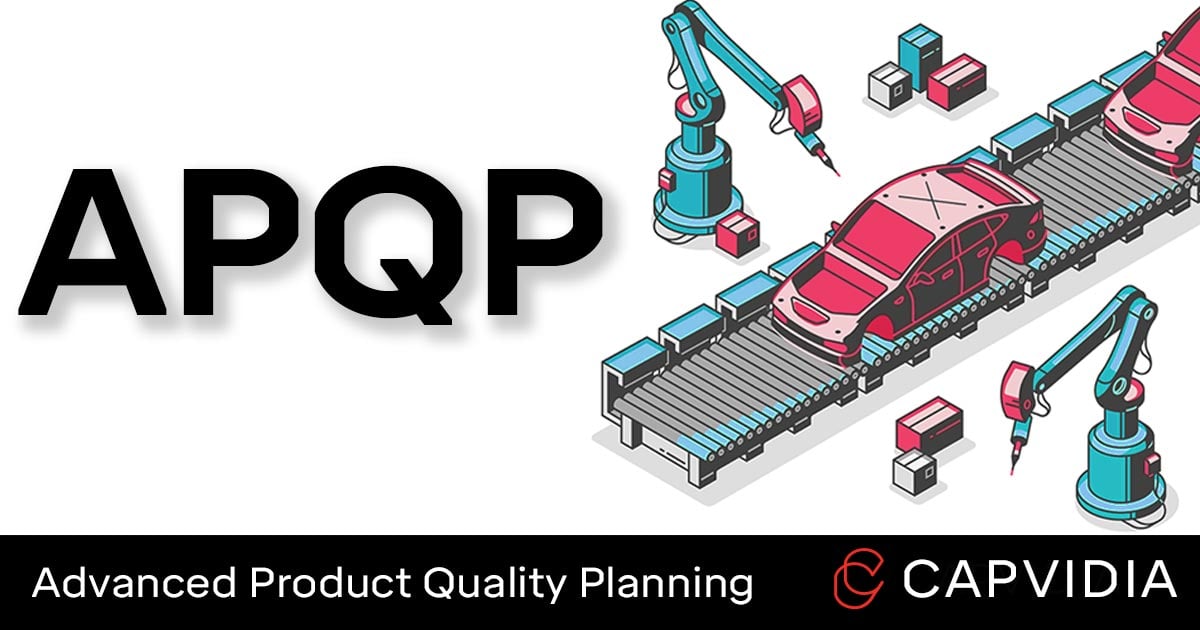
APQP is the process framework for developing new products or processes specified by time-based milestones and defined inputs and outputs. This document aligns the manufacturer’s ability to meet customer requirements through standardized communication and reducing quality planning complexity.
The APQP process consists of 5 phases:
Learn More: APQP Explained: In-Depth Guide
PPAP in one sentence: "Can we repeatedly and reliably make the part/product that meets customer expectations?”
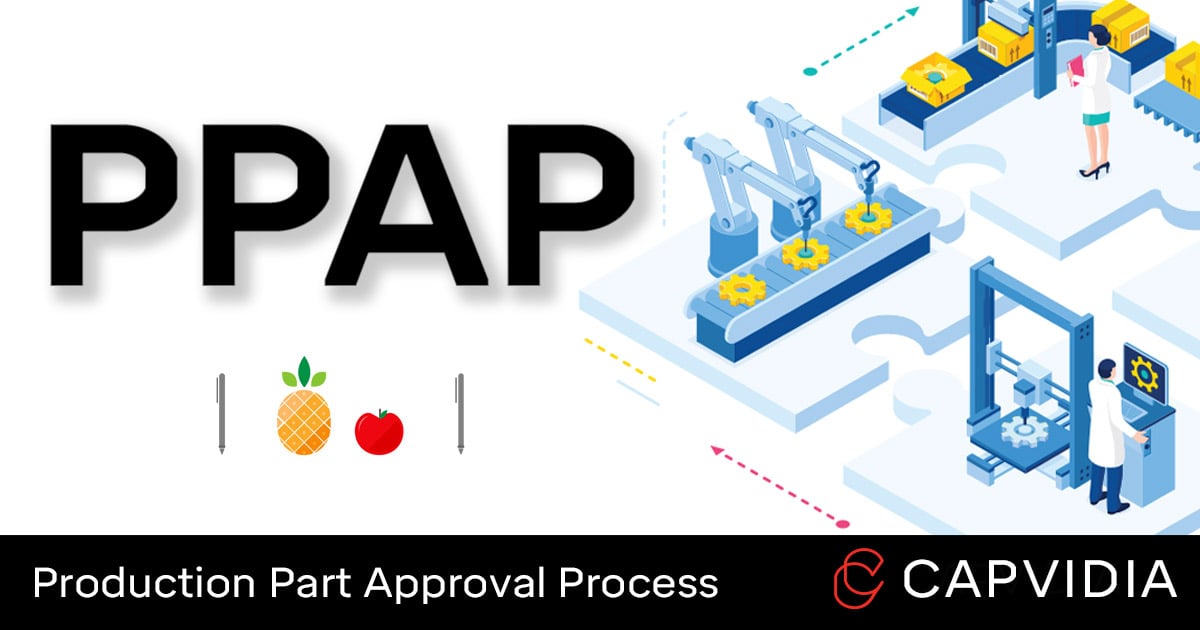
PPAP is the formal process of documenting the supplier’s ability to understand the customer requirements, have agreed-to and documented expectations, and produce parts/products in a reliable and repeatable manner.
The PPAP report consists of 18 elements:
Learn More: PPAP Explained: In-Depth Guide

Need help understanding the 5 Core Quality Tools?Contact us today and our Support Team can helpContact Us
FMEA in one sentence: “What can go wrong in the process or product, and how bad can it get?”
FMEA is a risk assessment method for evaluating potential modes of failure, the consequences and severity of those failures, and actions to prevent or mitigate those failures.
There are many types of FMEA including design (DFMEA), process (PFMEA), system, software, etc.
FMEA’s risk analysis is prioritized by 3 categories:
Learn More: FMEA Explained: In-Depth Guide
MSA in one sentence: “How do we know the tools we’re using for measuring are accurate?”
MSA is a statistical analysis of the reliability of the entire measurement system. It evaluates whether the variability in the measurement process is within acceptable tolerances and that any unacceptable tolerances may be due to equipment/gage, operator, method, environmental, etc. errors.
MSA is defined by 2 types of measurement variation:
1. Accuracy (close to target)
2. Precision (close to each other)
Learn More: MSA Explained: In-Depth Guide
SPC in one sentence: “How do we know our process (people, tools, environment, etc.) is reliable?”
SPC is a statistical method of quality control that collects and analyzes variability data from product and process measurements—the goal being to determine what falls within process capability and corrective actions for what falls outside process capability.
Variation in manufacturing has two classes:
The 14 most used SPC tools include:
Quality control tools:
Supplemental tools:
Learn More: SPC Explained: In-Depth Guide
Currently, most of the 5 Core Quality documentation is done manually through human transcription and interpretation.
Secondly, most 5 Core Quality data is used for pass/fail confirmation and discarded.
As digital transformation enters the manufacturing industry, connecting the digital thread (known as Industry 4.0) throughout the product lifecycle is vital for future growth.
Model-based definition and model-based enterprise are the processes of using an annotated 3D CAD model with manufacturing data (e.g. GD&T) that can make data collection for APQP, PPAP, FMEA, MSA and SPC more robust and faster, allowing automation, traceability, and compatibility across different silos.
More importantly, in the age of AI, Big Data, and deep learning, MBD provides the ability to data-mine the 5 Core Quality data for product and process improvements that can lead to breakthroughs and bottom-line impact.
Less reliance on manual processes. More futureproofing by digging to analytics. This is the future of manufacturing in a digital world.
Contact us today and our support team can provide solutions to improving your workflow.

SPC is a statistical method of quality control that collects and analyzes data from product and process measurements for improved process capability.
Learn more about APQP and the APQP process for quality improvements in the manufacturing process and product requirements.
Learn more about measurement systems analysis and the future of MSA through MBD.