PPAP
APQP Explained: 2023 Guide
Learn more about APQP and the APQP process for quality improvements in the manufacturing process and product requirements.
Learn more about FMEA and the FMEA process for quality improvements and reducing risk in the manufacturing process and product.

Failure Mode and Effects Analysis (FMEA) is a systematic, step-by-step approach for identifying all possible failures in a design, a manufacturing or assembly process, or a product or service.
It’s a risk assessment tool that helps to anticipate what might go wrong (failure mode), its impact (effects analysis), and how to prevent it by addressing the issues proactively.
Failure Mode and Effects Analysis is a living document that:
FMEA is integral to the five Core Tools that underpin effective quality management, standing alongside APQP (Advanced Product Quality Planning), PPAP (Production Part Approval Process), MSA (Measurement System Analysis), and SPC (Statistical Process Control).
Types of FMEA:
- Design FMEA (DFMEA)
- Process FMEA (PFMEA)
- Functional FMEA (FFMEA) / System FMEA (SFMEA)
- Software FMEA
FMEA is a preemptive look into identifying potential problems earlier in the design process.
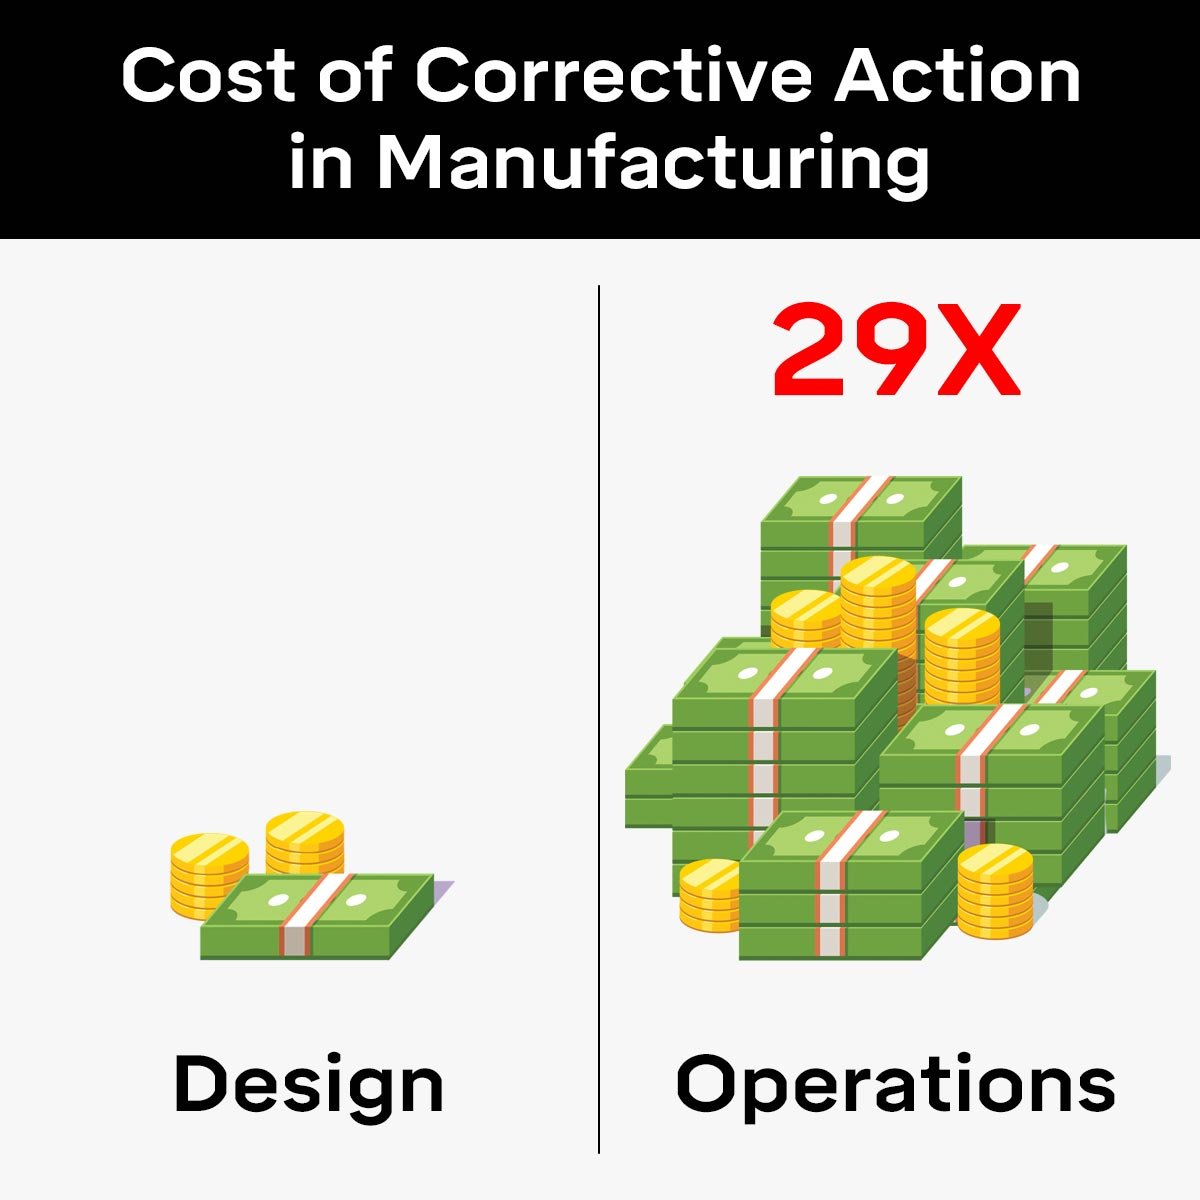
Costs related to waste, rework, defects, additional testing, and product recalls escalate.
These costs grow substantially when issues are corrected later in the product's life cycle. To illustrate, addressing problems during the operations phase can be at least 29X more costly than the design phase.
The Cost of Poor Quality (COPQ) is a metric that quantifies the expenses linked to product and process failures. Efficient manufacturers report a COPQ score around 1%, while those performing less efficiently may see COPQ around 5%.
To visualize the impact, consider two companies each generating $100 million in annual revenue. The company with a 1% COPQ will incur about $1 million in costs due to waste and rework, whereas the company with a 5% COPQ will face $5 million in similar costs.
Over time, this difference in COPQ can represent a substantial sum that could otherwise be invested in key business initiatives.
While FMEA may not foresee every possible failure, it significantly diminishes both the likelihood and the severity of risks.
5 Benefits of FMEA
- Improved product and process reliability, quality, and safety.
- Identify and eliminate or reduce potential product and process failures.
- Document and organize shared knowledge for current and future use.
- Reduce costs and problems later in the product lifecycle.
- Better customer satisfaction.
FMEA is typically used for the following scenarios:
New Products or Processes: When a company develops a new product or implements a new process, FMEA is critical to identify potential failures before they can become real problems.
Existing Products and Processes: For existing products or processes, FMEA is necessary when modifications are made, as changes can introduce new failure modes.
Regulatory Compliance: In industries with stringent regulatory requirements, such as automotive, aerospace, pharmaceuticals, and medical devices, FMEA is necessary to ensure compliance with safety and quality standards.
After a Failure Event: Following a failure or identification of a defect, conducting an FMEA can help pinpoint the root cause and prevent recurrence.
Risk Management: As part of a broader risk management strategy, FMEA is used to assess and mitigate risks, especially where the potential consequences of failure are severe.
Complex Systems: For complex systems where the interaction between components is not fully predictable, FMEA helps understand the interdependencies and the potential for systemic failures.
Cost Reduction Initiatives: When cost reduction efforts are planned, such as changes in materials or suppliers, FMEA is important to ensure that quality and reliability are not compromised.
Before Scaling Production: Prior to scaling up production, FMEA is essential to ensure that the manufacturing process can reliably produce the product at a higher volume without defects.
Continuous Improvement: As part of continuous improvement programs, FMEA is a proactive tool to improve quality and performance over time systematically.
Customer Requirements: Sometimes, customers, particularly in B2B relationships, require their suppliers to conduct FMEA to ensure that products meet their quality and reliability standards.
The FMEA process comprises a cross-functional collaborative team composed of members in engineering, manufacturing, quality, operations, procurement, and other functions with a process manager responsible for managing the project.
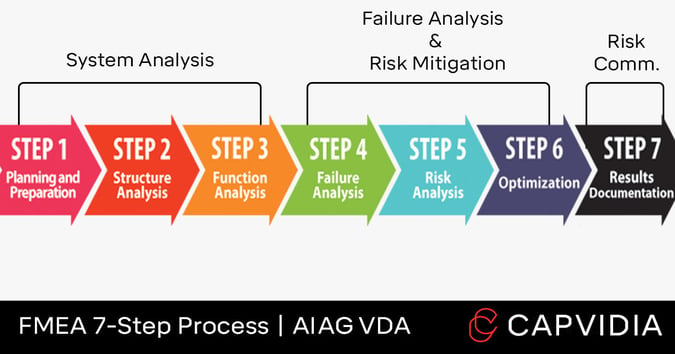
The FMEA process (by AIAG and VDA standards) is typically defined in seven steps. Each step is sequential, so the previous step creates an output that serves as the next step’s input.
Here is the FMEA 7-Step Process:
System Analysis
Failure Analysis and Risk Mitigation
Risk Communication
In Planning & Preparation, the team defines the purpose and definition of the scope, sets boundaries of the analysis (what needs to be included or excluded), and establishes the foundation for the entire FMEA process.
Project planning can be broken down into 5 topics known as the 5 T’s:
In Structure Analysis, the system structure is further clarified for technical analysis.
The boundaries set up in Planning & Preparation are analyzed to identify which systems, sub-systems, and/or components will be part of the FMEA.
For Design FMEA (DFMEA), interfaces (physical connection, material exchange, energy transfer, data exchange, and human-machine), interactions, and close clearances are identified.
For Process FMEA (PFMEA), process steps and sub-steps are identified.
Additional tools to support the Structure Analysis are provided such as a structure tree, block diagram, boundary diagram, flow diagram, or other visualization tools.
In Function Analysis, the product and process functions are explored, as well as the criteria for evaluating the performance of functions.
The system elements in the Structure Analysis are individually analyzed for their functions and corresponding requirements.
For DFMEA, functions and requirements are identified by the next higher level function (highest level of integration within the scope of analysis), focus element (item in focus), and next lower level function (element that is next level down the structure from focus element).
For PFMEA, functions and requirements are identified by function of process item system, function of process step and product characteristic, and function of the process work element and process characteristic.
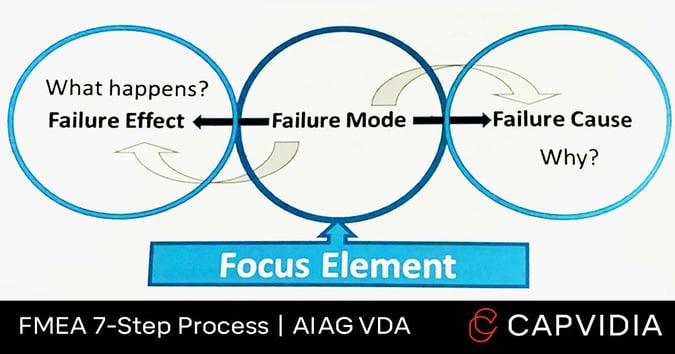
In Failure Analysis, the team establishes a Failure Chain through the cause-and-effect relationships of these 3 categories:
Types of potential failure modes include:
In Risk Analysis, root cause analysis is estimated and prioritized by evaluating these 3 categories:
Each risk category has a scoring matrix from 1 to 10, with 1 being low-risk to 10 being high-risk:
| Severity |
Occurrence | Detection |
||||
| S | Effect | O | Effect | D | Effect | |
| 9-10 | Very high | 10 | Extremelyhigh | 9-10 | Very low | |
| 7-8 | High | 8-9 | Very high | 7-8 | Low | |
| 4-6 | Moderate | 6-7 | High | 5-6 | Moderate | |
| 2-3 | Low | 4-5 | Moderate | 2-4 | High | |
| 1 | Very low | 2-3 | Low | 1 | Very high | |
| 1 | Very low | |||||
In a previous FMEA risk analysis, each score is multiplied together (Severity x Occurrence x Detection) to produce a Risk Priority Number (RPN). However, RPN alone is inadequate since it gives equal weight to Severity, Occurrence, and Detection.
In a newer FMEA risk analysis, priority is given to Severity first, then Occurrence, and then Detection, creating better decisions to prioritize risks.
This new method is called Action Priority (AP) and accounts for all 1,000 combinations of Severity, Occurrence, and Detection and is ranked by three classifications:
Risks with a Severity score of 7 and above are predominately high AP.
Example of AP Table:
| Action Priority (AP) for DFMEA and PFMEA | ||||||
| Action Priority is based on combinations of Severity, Occurrence, Detection ratings to prioritize actions for risk reduction. | ||||||
| Effect | S | Prediction of Failure Cause Occurring | O | Ability to Detect | D | Action Priority (AP) |
| Product or Plant Effect Very High | 9-10 | Very high | 8-10 | Low - Very Low | 7-10 | H |
| Moderate | 5-6 | H | ||||
| High | 2-4 | H | ||||
| Very high | 1 | H | ||||
| High | 6-7 | Low - Very Low | 7-10 | H | ||
| Moderate | 5-6 | H | ||||
| High | 2-4 | H | ||||
| Very high | 1 | H | ||||
| Moderate | 4-5 | Low - Very Low | 7-10 | H | ||
| Moderate | 5-6 | H | ||||
| High | 2-4 | H | ||||
| Very high | 1 | M | ||||
| Low | 2-3 | Low - Very Low | 7-10 | H | ||
| Moderate | 5-6 | M | ||||
| High | 2-4 | L | ||||
| Very high | 1 | L | ||||
| Very low | 1 | Very high -Very low | 1-10 | L | ||
In Optimization, the team develops a plan of action to mitigate risks and assess the effectiveness of the optimization actions.
Actions are divided into 2 categories: prevention and detection.
Assignments of responsibilities and deadlines are given.
After actions have been performed, the team reviews the results to rescore the risks.
In Results Documentation, the FMEA is summarized, documented, and communicated to the team and stakeholders.
The FMEA report includes a summary of scope, identification of high-risk failures, the corrective actions taken and their effectiveness, and insights/plans for current and future processes.
The results documentation is to summarize and communicate the results of the FMEA activity.
5 Common FMEA Mistakes:
- Performing FMEA too late: The earlier in design phase the better.
- Accountability of required actions: Have clear ownership for parts of the process.
- Setting it and forgetting it: FMEA is a living document of continuous improvement.
- Poor documentation: Useful documentation limits redundancies and leaves insight for future teams.
- Poor root cause identification: Due diligence confirms a proper solution and not wasted efforted and continued defects.
FMEA is a lot of work.
Some challenges include the considerable number of documents, spreadsheets, and people involved--especially with constantly updating data as the complexity of the project evolves.
The traditional drawing-based, paper-based workflow leads to increased laborious and repetitive manual work (especially repeat data entry), a lack of organization and consistency for all FMEAs, and a need for a structured knowledge base for current and future insights.
Digitization is the future here.
A model-based approach called MBD (model-based definition) uses a single source of truth: the 3D CAD model + PMI (product manufacturing information) to store the geometry and manufacturing data to build and measure a part that could be used downstream throughout the entire supply chain.
This model contains a large portion of the product definition and requirements (e.g. information regarding significant characteristics, etc.) which follows the FMEA analysis. Additional data like risk information and process plans can also be generated using requirement management software tools or MBDVidia.
When you have a digital source for your data which includes production definition and tolerances (MBD), product requirements and risks, process plan info, etc., then it all becomes streamlined significantly.
The results: automatic time-savings and a more repeatable and faster FMEA process.
The ISO QIF standard provides the ability to digitize the MBD, Control Plan (from FMEA), measurement results (PPAP and MSA), and measurement statistics (SPC). The industry is rapidly adopting QIF as the digital backbone of the MBD transformation in the manufacturing industry.
If FMEA unifies early risk analysis (the what), the MBD-based FMEA process unifies the risk analysis process (the how).
FMEA evaluates potential failure through 5 questions:
When properly implemented and documented, current and future teams can detect failure earlier in the manufacturing process. This creates immediate time and cost savings upfront vs the exponential time and cost expenses when fixed later in the product lifecycle.

Capvidia is a leader in MBD-based workflows and all things pertaining to digital transformation in the manufacturing industry.
Learn more about APQP and the APQP process for quality improvements in the manufacturing process and product requirements.
Learn more about 5 Core Quality Tools for preventing and minimizing error, improving the manufacturing process and product, and impacting the company...
Learn more about production part approval process and PPAP reports through MBD. Automate ballooning and measurement reports easily.